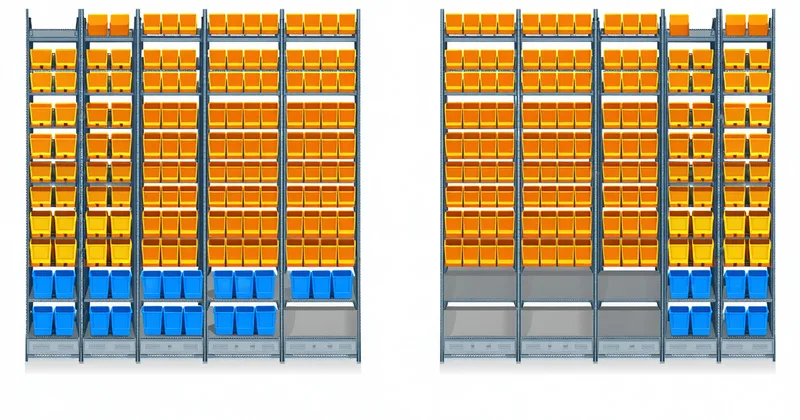
Walk through any mid-size fulfillment center during a peak shift and you'll observe the same phenomenon: a handful of pick faces get hit dozens of times per hour while hundreds of bin locations sit untouched for days. That imbalance isn't a scheduling failure — it's the natural signature of SKU velocity distribution, and it's the most important variable in deciding which items your autonomous pick cell should own.
Most operations that deploy autonomous picking make the same early mistake: they assign the robot cells to the physically densest area of the pick face and call it done. Pick density — the number of picks per square foot per hour — matters, but by itself it's an incomplete signal. What actually determines whether autonomous picking adds throughput is the intersection of density and SKU velocity profile.
The A/B/C/D Velocity Segmentation You Actually Need
Standard ABC analysis divides SKUs into three movement tiers based on order frequency. That's a reasonable starting point for slotting, but for pick cell allocation you need a fourth tier, and the tier boundaries have to be drawn tighter than most WMS default configurations produce.
Here's the framework we use during pre-deployment site surveys:
- A-class (fast movers): SKUs picked more than 15 times per shift per pick face location. These are your high-velocity, predictable items. Robot performance is excellent here — the vision model has high confidence on consistent packaging, pick paths are short, and cycle time is low.
- B-class (medium movers): 4–14 picks per shift. This is where most of the throughput volume lives in a typical 3PL. B-class SKUs represent 20–35% of your catalog but often account for 55–65% of total pick events. Autonomous picking performs well here with minimal exception rates when the pickability score is above threshold.
- C-class (slow movers): 1–3 picks per shift. Individually low volume, collectively significant. Human pickers are faster at low-frequency items because they don't require a fresh vision calibration cycle for each pick event.
- D-class (dormant): Less than 1 pick per shift on average. These should be in reserve storage, not forward pick area. If D-class items are cluttering your pick face, the slotting needs to be corrected before deploying any autonomous system — robot or otherwise.
The practical insight here is that A and B class together typically cover 25–40% of your SKU catalog while generating 80–90% of pick events. That concentration is what makes velocity-tiered allocation work: you don't need to solve every SKU — you need to solve the right 30%.
Pick Density vs. Pick Frequency: Why Both Numbers Matter
Pick density (picks per square foot per hour) tells you how congested a zone is. Pick frequency (picks per SKU per shift) tells you how predictable a specific item is. A robot cell optimized for density without regard for frequency will hit its throughput ceiling faster than expected, because it's spending time on irregular items that require longer vision processing and more gripper attempts.
Consider a concrete scenario: a mid-size fulfillment operator in the Pittsburgh area running nine client accounts across a 180,000 sq ft facility had a forward pick area with measured density of 42 picks per 100 sq ft per hour across the whole zone. That looked like strong robot territory. But when we ran a 90-day mover analysis on the SKU file, we found that 38% of the items in that zone were C-class — they only appeared in picks because clients had historically requested they be kept in the forward area for "just in case" availability. The actual A/B class density in that same zone was closer to 26 picks per 100 sq ft per hour — well below the threshold where autonomous picking produces meaningful ROI without a slotting reorganization first.
The fix wasn't a robot — it was slotting. After moving D-class items to reserve and consolidating C-class to a dedicated human-only pick zone, the A/B forward density climbed to 61 picks per 100 sq ft per hour. That's a zone where an autonomous pick cell produces real throughput gains.
The Mover Analysis Protocol Before Any Deployment
We won't deploy a pick cell without a minimum 60-day mover analysis on the site's actual order data. The analysis needs to answer five questions:
- What percentage of forward pick face SKUs are A or B class by the site's own historical demand?
- What is the peak-to-average ratio for A-class SKUs? High ratio (above 3:1) means the robot will be underutilized outside peak windows.
- Do any client accounts have SKU mix that is predominantly C/D class? Those accounts should stay in human pick zones — don't let them dilute the robot cell's efficiency metrics.
- What is the physical pick face configuration? Golden zone coverage (knees to shoulders, roughly 24–48 inches above floor) matters for gripper reach envelope.
- How stable is the forward pick face? Client SKU turnover — when clients add or discontinue products — forces slotting updates. High turnover means more frequent replenishment events and more pick face disruption for the robot's vision model.
This isn't about gatekeeping a deployment — it's about making sure the cell hits its throughput targets from day one rather than spending three months in a tuning spiral.
Where Autonomous Allocation Breaks Down
We're not saying autonomous picking doesn't work for C-class items — we're saying it doesn't work efficiently for C-class items in a multi-tenant 3PL context where pick cell ROI is calculated per unit cost. A single-tenant fulfillment center might accept a 15% exception rate on slower items if the overall throughput gains are sufficient. A 3PL with per-pick billing commitments to clients can't absorb that tolerance — it shows up immediately in cost-per-pick variances between clients.
The other common breakdown point is peak-season SKU introduction. When a client onboards 200 new seasonal SKUs in November, those items have zero historical velocity data. Until they accumulate enough picks to establish a reliable class assignment — typically 2–3 weeks of order data — they should default to human pick zones. Routing unclassified SKUs to the robot cell during peak season, when throughput pressure is highest, is one of the fastest ways to produce a poor outcome that gets attributed to the technology rather than to the allocation logic.
Building the Allocation Logic Into Wave Planning
Once you've done the velocity segmentation work, the allocation model needs to be embedded in how your WMS generates pick waves, not as a post-processing step. This means the wave release from Manhattan Active WMS, Blue Yonder, or SAP EWM needs to carry SKU-class metadata that Pickrook's routing layer can read and act on before assigning items to robot versus human pick queues.
The integration point is the wave release event: at the moment the WMS releases a wave, each order line should be tagged with its velocity class. Items tagged A or B above the pickability threshold go to the robot cell queue. Items tagged C, D, or below pickability threshold go to human pick queue. Exception handling is a separate routing layer — items that fail vision verification mid-pick get directed to the exception tote station immediately, not recycled back into the robot queue.
This architecture keeps the robot cell's pick rate clean. If you allow the robot to attempt picks on items it's likely to fail, your reported PPH (picks per hour) becomes meaningless as a performance benchmark because it's counting attempts, not completions. Completed picks per robot hour — with exceptions broken out separately — is the only number worth tracking.
What Sustained PPH Actually Looks Like
In validated deployments where the mover analysis was completed and slotting was corrected before go-live, Pickrook pick cells sustain 280–360 picks per hour on A/B class SKU queues during standard operating conditions. That's the robot cell's contribution. The human pick zones running in parallel handle C-class, exception items, fragile SKUs, and irregular cases — and their PPH typically improves as well, because they're no longer burdened with the high-frequency repetitive picks that cause fatigue.
The right framing for your operations team is not "the robot replaces X pickers." It's "the robot handles the category of picks that fatigues pickers fastest, which means your human pickers can sustain higher quality output across their shift." That reframing also matters for workforce communication — it's accurate, and it's how the operations directors we've worked with have successfully introduced autonomous picking to their teams without morale problems.
SKU velocity profiling isn't glamorous pre-deployment work. It requires pulling order history, running a proper mover analysis, and having a direct conversation with your WMS team about how velocity class tags can be surfaced at the wave release event. But it's the work that determines whether your pick cell hits its throughput target in week four or week twenty-four. We've seen both outcomes. The difference is almost always the pre-work.
If you want to run Pickrook's velocity profile framework against your facility's SKU data before committing to a deployment conversation, reach out here — the pre-deployment analysis is part of every pilot engagement.